|
The Area Under the Defocus CurveHow is it calculated? |
|
|
|
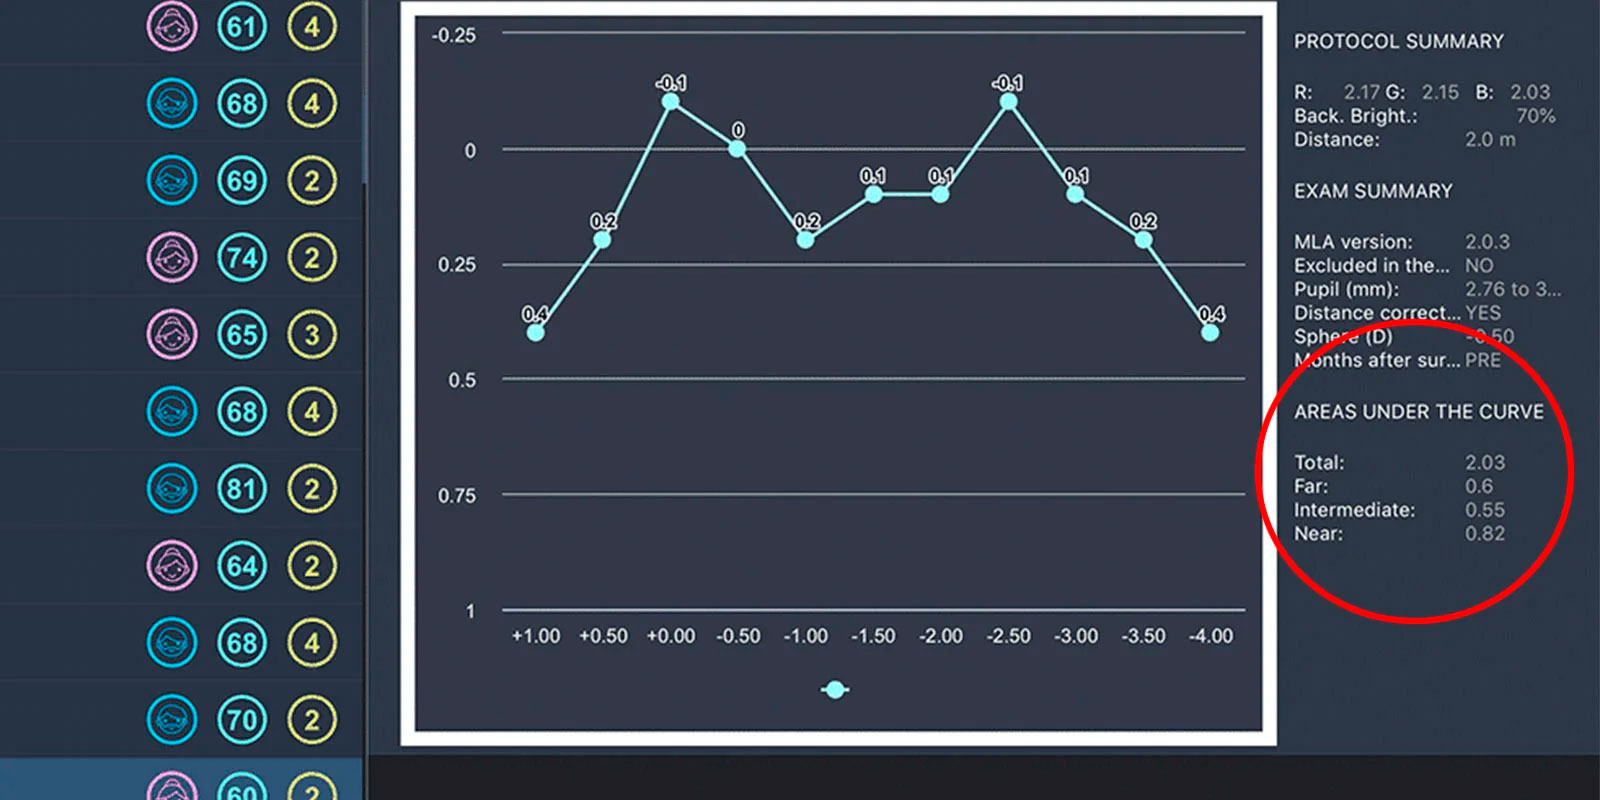
The Defocus Curve provides a great deal of information that sometimes can be difficult to interpret by looking at the results for each single defocus step. For example, when we measure visual acuity at near (40 cm) we only have one result at a distance but when we measure a defocus curve we can have, if we go from -2.00 to -4.00 D in 0.50 D steps, up to 5 values that describe visual performance at near from 50 cm to 25 cm. How do we take advantage of all this information to draw conclusions about visual performance at near?
The solution to this problemThe solution to this problem is found in the Area Under the Defocus Curve (AUC) which was first suggested by Buckhurst et al1 in the article "Multifocal Intraocular Lens Differentiation Using Defocus Curves" with the aim of differentiating between different multifocal intraocular lenses. This area is calculated over the entire range of visual acuities below 0.3 logMAR, which means that only visual acuities better than this value are considered in the calculation. This cut-off point was proposed by Wolffsohn et al2 arguing that this point is widely accepted as the visual acuity required to obtain a driving licence in the European region. How does the Multifocal Lens Analyzer calculate the area under the defocus curve?The MLA follows the Trapezoidal Numerical Integration method by normalizing the 0.5 D step to the unit. The only difference with the non-normalized calculation is that the area obtained with the MLA will be double that obtained with a non-normalized method. If you want to calculate these areas in the same way as MLA you can use for example the default function of Matlab _Q = trapz(Y) The following values are taken into account when calculating the area under the defocus curve:
Since the MLA allows us to configure the range of diopters to be measured as well as to insert ±0.25 D around the 0 D point in extended depth of focus (EDOF) procedures, it is important to know that areas will only be calculated for those zones that incorporate the ranges described above. This means that if we choose to measure the curve from +2.00 D to -2.00 D with ±0.25 D interspersed, the App will only give me the area under the curve for the Far and Intermediate regions, discarding the results obtained for the ±0.25 D points, the total area and the near area since it does not have enough information to calculate the ranges that we have considered above. What are the advantages of calculating the area under the defocus curve?From the clinical point of view, the main advantage has already been mentioned at the beginning of the article, it describes a range of vision instead of describing a single point. For example, two Multifocal Intraocular Lenses (LIOMs) could have the same Visual Acuity at 40 cm but one of them might have better vision in the range from 50 cm to 25 cm so it would have a higher performance in near vision. From a research point of view, using the areas under the curve as indexes instead of isolated values will provide us with greater statistical power in our studies since the areas under the curve present less variability than isolated visual acuities. If you want to know how the areas under the defocus curve correlate with different ocular biometric parameters we recommend two studies with LIOMs.[3,4] Referencias:
|