|
VisionCMeasure Low and High Contrast Visual Acuity at Far, Intermediate and Near distances with this Standardized ETDRS test for the iPad.Added support for iPads until the end of 2022 in the latest update 2.1.1
|
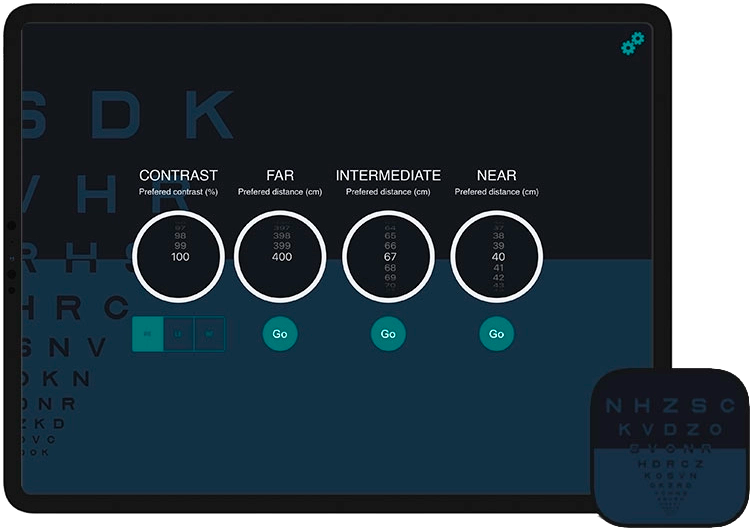 |


VisionC is the first fully configurable ETDRS optotype chart to be presented at any distance from 20 cm to 400 cm (in 1 cm steps) and for any contrast from 0 to 100% (1% steps). It allows you to control the optotype and background luminances for a reliable and repeatable measurement of Visual Acuity.
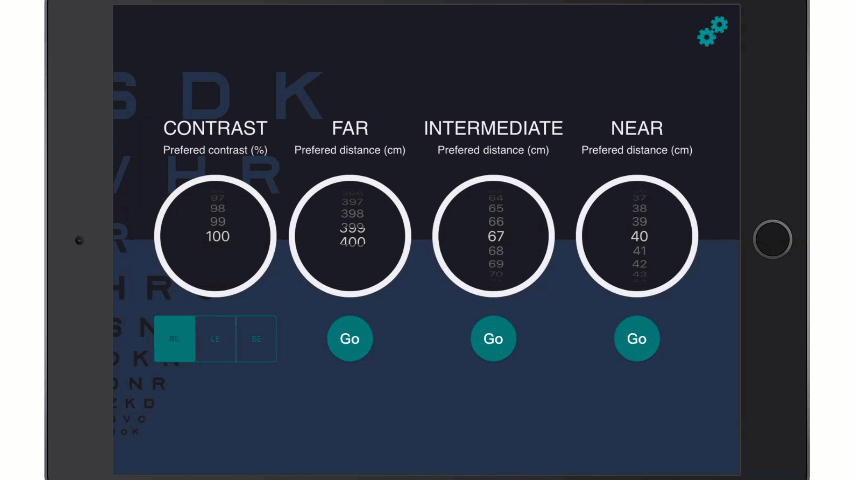
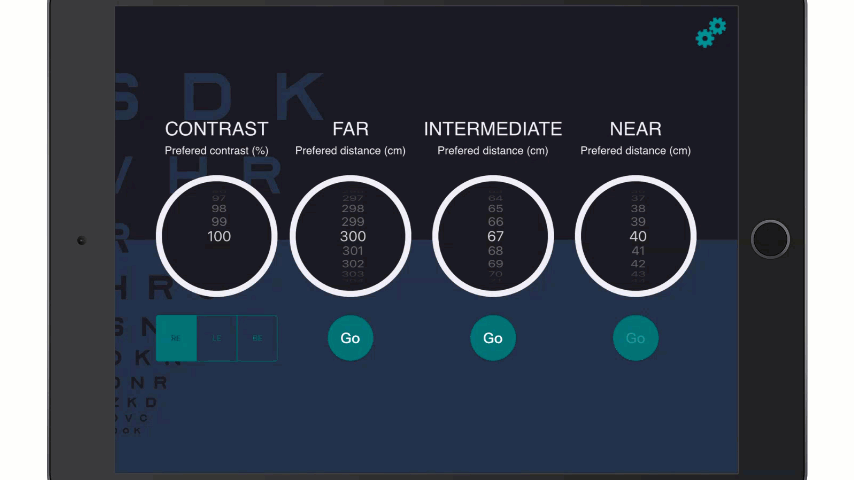
La agudeza visual medida de forma estanzarizada con el ETDRS normalmente se toma a tres distancias (lejos, intermedia y cerca) en estudios con pacientes présbitas o implantados con lentes intraoculares. Sin embargo, los estudios de investigación en ocasiones difieren en la distancia específica para cada una de estas categorías. Con VisionC puedes seleccionar la distancia específica para cada una de estas tres configuraciones de tal manera que puedes rápidamente acceder a la distancia específica que desees. Standardized measurement of Visual acuity with the ETDRS is usually conducted at three distances (far, intermediate and near) in studies with presbyopic or intraocular lens implanted patients. However, research studies sometimes differ in the specific distance for each of these categories. With VisionC you can select the specific distance for each of these three settings so that you can quickly access the specific distance you want.
The App provides different letter packs in order to avoid possible memorization when the letter is presented in far, intermediate and near or when measuring the right, left and both eyes.
|
To measure vision, it is mandatory to switch off the automatic brightness in order to keep the background luminance constant for any ambient light used. The brightness of the screen may change if you put the app in the background or put the iPad in standby mode. This may result in taking measurements for different brightness conditions or background luminance. However, VisionC unlike other Apps automatically detects when the screen brightness has changed and modifies the background brightness to the one stored in the App each time you use the App to measure vision. Nevertheless, we recommend to continue to keep the automatic brightness turned off on your iPad. |
 |
Regardless of whether you measure far, intermediate or near vision, the ETDRS procedure is the same:
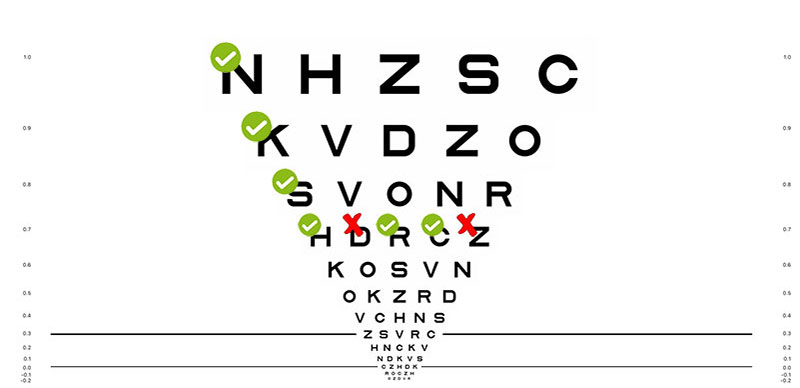
- Start by reading only one letter per line. For example, the first letter starting from the left or from the right and move down after each correct answer to the next line.
- After the first mistake, go up one line with respect to where the error occurred and ask the patient to read the 5 letters (full line).
- If the patient gets <3/5 correct move up one line and ask again for the 5 letters.
- If the patient gets ≥ 3/5 correct move down to the next row and ask again for the 5 letters.
- Visual Acuity will be the last line for which the patient got ≥ 3/5 correct answers.
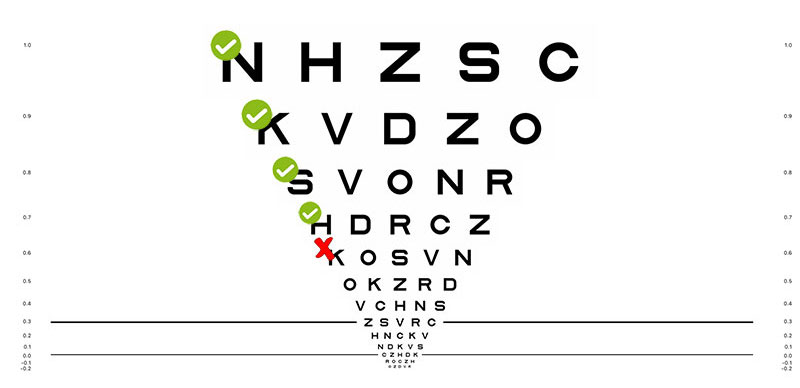
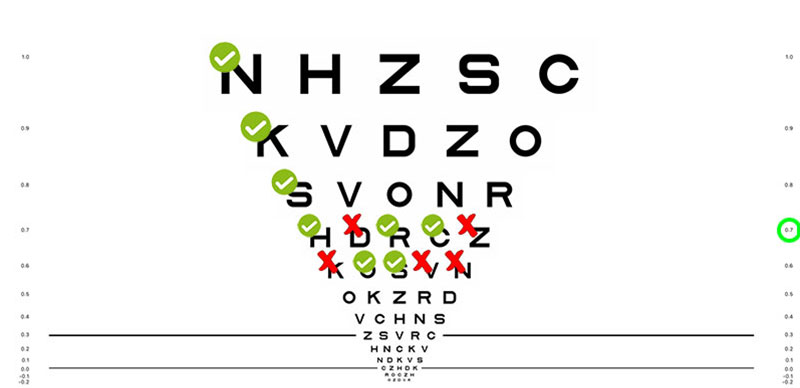
Here is an example:
|
Step 1. The patient starts reading only the first letter and scrolls down with each hit until the first wrong answer, this being 0.6 logMAR. |
Steps 2 and 3. As the first wrong answer was at 0.6 logMAR, we ask the patient to read the previous line of 0.7 logMAR. Recognizing 3/5 letters on this line. |
Step 4 and 5. When we get 3/5 correct, we move to the next line and ask for the reading of the complete 0.6 logMAR line. The patient gets only 2/5 letters right. Being the final value 0.7 logMAR that corresponds to the last line in which he recognized at least 3/5. |
|
To measure distance visual acuity you have to first select the distance using the "FAR" selector, then place the iPad at the selected distance from the patient and start measuring with the ETDRS. Note that the size of the optotypes will be adjusted to be appropriate for the distance you select. La última distancia seleccionada aparecerá cuando reinicie la aplicación. A confirmation message will appear, please make sure that the iPad is at the distance indicated in the confirmation message. The last selected distance will appear when you restart the application. The measurement procedure for intermediate and near distances will be the same, only differing in the distance selector, you will find the one corresponding to the intermediate distance in the central part and the near distance on the right. The application has been developed so that you can quickly access each distance once selected. |
 |
|
This is one of the main advantages of VisionC over the use of static ETDRS optotype charts. You will be able to select up to three letter configurations so that you can complete right, left and binocular eye measurements, avoiding possible letter memorization bias. PTo change the letters of the optotype chart, simply select RE (Right Eye), LE (Left Eye) and BE (Binocular) before starting the test. |
 |
|
It is important to note that VisionC uses the standardized ETDRS design, which means that there is a progression of Visual Acuity on a logMAR scale. Even if you prefer to modify the notation to Snellen or Decimal, this will not affect the Visual Acuity measurement. This is not the case with other optotype charts not designed following a logMAR progression, which may lead to Visual Acuity measurement biases. Select "Settings" at the top right -> Select Notation -> Click on Close The visual acuity value is displayed on the right and left of each row. Very import!, if you decide to score visual acuity in Decimal or Snellen scale, remember to perform the subsequent conversion to logMAR notation before performing any statistical analysis. Performing statistical analysis in Decimal or Snellen notation leads to significant calculation errors. |
 |
|
Another distinguishing feature of VisionC is the ability to reliably measure low contrast Visual Acuity by simply selecting the % contrast in the first column. For this purpose, previous research (1) has been carried out to determine the iPad's ability to represent different contrast values. Based on these investigations, the Application has been carried out. It is important to note that the applications that you can find for mobile devices do not take into account this type of corrections. Not taking them into account may result in erroneous measurements of Low Contrast Visual Acuity. Select the percentage of contrast -> Use the test at the desired distance
|
|
In the iPad you can select the percentage brightness of the screen, however you need to know what is the background luminance for that brightness. The relationship between percentage brightness and luminance can vary between models and has been reported by Livingstone et al.(1) For example, iPads at 75% brightness varied between 165-202 cd/m2, and ETDRS cabins between 270-418 cd/m2 which means less variation between different iPad models than between different ETDRS cabins commonly used in the clinic.(1)
También puede encontrar relaciones entre el brillo y la luminancia en otros trabajos.(2–5) Las recomendaciones de estandarización internacional (ISO) establecen una luminancia de fondo de 80 cd/m2 a 320 cd/m2 y cerca de 200 cd/m2 para medir la agudeza visual en la práctica clínica.(6) Sin embargo, esta luminancia difiere de las 85 cd/m2 reportada en el consenso para ensayos clínicos.(7) De acuerdo con esto, nuestra recomendación es que use alrededor de 41% de brillo para medir alrededor de 85 cd/m2.
You can also find relationships between brightness and luminance in other papers.(2-5) International standardization (ISO) recommendations state a background luminance of 80 cd/m2 to 320 cd/m2 and about 200 cd/m2 for measuring visual acuity in clinical practice.(6) However, this luminance differs from the 85 cd/m2 reported in the consensus for clinical trials.(7) Accordingly, our recommendation is that you use about 41% brightness to measure about 85 cd/m2.
- Livingstone IA, Tarbert CM, Giardini ME, Bastawrous A, Middleton D, Hamilton R. Photometric compliance of tablet screens and retro-Illuminated acuity charts as visual acuity measurement devices. PLoS One. 2016;11(3):e0150676.
- Rodríguez-Vallejo M, Monsoriu JA, Furlan WD. Inter-display reproducibility of contrast sensitivity measurement with iPad. Optom Vis Sci. 2016;93(12):1532-1536.
- Aslam TM, Murray IJ, Lai MYT, et al. An assessment of a modern touch-screen tablet computer with reference to core physical characteristics necessary for clinical vision testing. J R Soc Interface. 2013;10(84):20130239.
- Tahir HJ, Murray IJ, Parry NR a, Aslam TM. Optimisation and assessment of three modern touch screen tablet computers for clinical vision testing. PLoS One. 2014;9(4):e95074. doi:10.1371/journal.pone.0095074
- Bodduluri L, Boon MY, Dain SJ. Evaluation of tablet computers for visual function assessment. Behav Res Methods. 2017;49(2):548-558. doi:10.3758/s13428-016-0725-1 ISO 10938:2016. Ophthalmic optics. Chart displays for visual acuity measurement. Printed, projected and electronic.
- MacRae S, Holladay JT, Glasser A, et al. Special Report: American Academy of Ophthalmology Task Force Consensus Statement for Extended Depth of Focus Intraocular Lenses. Ophthalmology. 2017;124(1):139-141. doi:10.1016/j.ophtha.2016.09.039
|
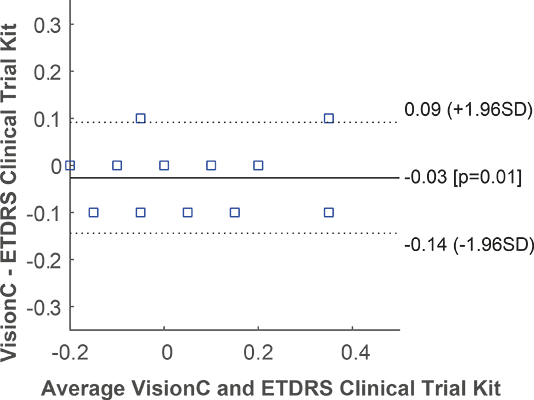
The optotype generation algorithms used by VisionC have been previously validated and reported in scientific publications for other visual acuity measurements incorporating automated threshold calculation algorithms.(1) In addition, internal studies have been carried out to evaluate the agreement between the VisionC App and the ETDRS test recommended by the FDA for the development of clinical trials (image on the right). In particular, 39 eyes were measured with both systems, finding mean differences of only one letter (0.03 logMAR) and individual differences of no more than one line of visual acuity, i.e., differences that are within the limits of repeatability of visual acuity measurement. In addition, VisionC has been used to evaluate the agreement between high and low contrast objective visual acuity prediction with the HD Analyzer system.(2) The variable contrast optotype generation algorithms have also been validated in previous research and developed based on the contrast rendering capabilities of the iPad. It is for this reason that the App is not available for Android, as it is impossible to guarantee a reliable measurement of variable contrast visual acuity on an Android tablet without a previous display calibration. In contrast, VisionC has been developed considering the characterization of the luminance properties of dozens of iPads.(3) |
 |
- Rodríguez-Vallejo, M., Llorens-Quintana, C., Furlan, W. D., & Monsoriu, J. A. (2016). Visual acuity and contrast sensitivity screening with a new iPad application. Displays, 44, 15–20.
- Fernández, J., Rodríguez-Vallejo, M., Martínez, J., Burguera, N., & Piñero, D. P. (2021). Agreement between subjective and predicted high and low contrast visual acuities with a double-pass system. Graefe’s Archive for Clinical and Experimental Ophthalmology, 259(6), 1651–1657.
- Rodríguez-Vallejo, M., Monsoriu, J. A., & Furlan, W. D. (2016). Inter-display reproducibility of contrast sensitivity measurement with iPad. Optom Vis Sci., 93(12), 1532–1536.
Visual acuity is a crucial aspect of our vision that helps us perceive and interpret the world around us. It refers to our ability to see clearly and discern small details at various distances. To measure visual acuity, eye care professionals use acuity charts, also known as eye charts, to assess a patient's ability to see letters or symbols of varying sizes. These tests can help diagnose eye conditions, monitor progression, and determine the effectiveness of treatment.
The most commonly used eye chart is the Snellen chart, developed by Dutch ophthalmologist Herman Snellen in 1862. It consists of eleven lines of uppercase letters, with the letters decreasing in size as you move down the chart. The letters are arranged in a specific pattern to eliminate any guesswork from the patient. The chart is designed to be viewed from a distance of 20 feet, and a person's visual acuity score is determined by the smallest line of letters they can accurately read. Another popular chart is the ETDRS chart, developed by the National Eye Institute's Diabetic Retinopathy Study. This chart is more precise than the Snellen chart and is used primarily in clinical trials and research studies. It includes ten letters on each line, and the letters are spaced out evenly, unlike the Snellen chart, which has varying letter spacing. The ETDRS chart also uses a logarithmic progression in letter size, which allows for a more accurate measurement of visual acuity. Other acuity charts used in clinical practice include the Bailey-Lovie chart, the Pelli-Robson chart, and the LogMAR chart.
The Bailey-Lovie chart is similar to the ETDRS chart, but the letter sizes are not as precise. The Pelli-Robson chart uses letters of equal size but varying contrast levels. The LogMAR chart, like the ETDRS chart, uses a logarithmic progression in letter size but includes letters of equal legibility, making it useful for patients with low vision. For near vision testing, eye care professionals use charts such as the Kay Picture chart or the Landolt C chart. The Kay Picture chart uses pictures of common objects, while the Landolt C chart uses symbols of different orientations. These charts are typically used for people who have difficulty reading standard charts or who require near vision correction.
Acuity testing is an essential part of a comprehensive eye exam and is particularly important before cataract surgery or for patients with diabetic retinopathy. The results of an acuity test can help eye care professionals determine the best course of treatment and monitor the progression of eye conditions. It is also useful in clinical practice for assessing the efficacy of corrective lenses or other interventions.
In conclusion, visual acuity testing is crucial in maintaining good eye health and preventing visual impairment. Acuity charts provide a standardized method for measuring visual acuity and are used in clinical practice and research studies. The development of more precise charts, such as the ETDRS chart, has allowed for more accurate and consistent measurements of visual acuity. Eye care professionals should continue to use these charts to ensure the best possible outcomes for their patients.
By downloading or using our Apps, these terms will automatically apply to you – you should make sure therefore that you read them carefully before using the app. You’re not allowed to copy or modify the app, any part of the app, or our trademarks in any way. You’re not allowed to attempt to extract the source code of the app, and you also shouldn’t try to translate the app into other languages or make derivative versions. The app itself, and all the trade marks, copyright and other intellectual property rights related to it, still belong to Manuel Rodríguez Vallejo (“the developer”).
1. Purpose of our Apps
1.1 Please be aware that all our apps have been designed for research and not for medical purposes. They are not intended for use in the diagnosis of disease or other conditions, or in the cure, mitigation, treatment, or prevention of disease. The information provided by our Apps is not intended to use for the benefit of individual patients, but it is intended to evaluate the results along a sample of patients in order to conduct research. By downloading and using our apps you agree to use them only for research purposes.
2. About the Data Stored in your Device
2.1 For achieving the previous purpose, the app stores in the device non-personal data using a pseudo-identifier in order to ensure that only the user who introduces the data might identify the subject. The developer does not collect any personal data from you or from the pseudo-anonymized data that you introduce in the app. All the data remain only in your device and can be encryptep by Apple and stored in the iCloud if you conduct an iCloud backup.
2.2 Although the developer has designed the app in order to prevent that you introduce personal data, he cannot take responsibility for you of the kind of number you use to pseudo-identify the subject. It is your responsibility to use a numeric unique pseudo-identifier that does not directly identify the subjects. If you use a re-identification file, it is important to note that this must comply with your local regulations, such as the GDPR in Europe or the HIPAA in the United States. For security reasons, maintain any re-identification file always outside from your device, on which the app is downloaded, or any other device linked to the same iCloud account, or your iCloud account itself.
2.3 It is also your responsibility to have the consent of the subjects for using their data for any purpose in case of being required. The app allows you to export the pseudo-anonymized data stored in the device by email, the developer cannot take responsibility if you do not manage or share the data in an ethic manner or according to your local applicable laws.
3. Services and Subscriptions
3.1 The developer is committed to ensuring that the app is as useful and efficient as possible. For that reason, we reserve the right to make changes to the app or to charge for its services, at any time and for any reason. We will never charge you for the app or its services without making it very clear to you exactly what you’re paying for. The scope of the services may depend on the subscription you have. The developer may change, update, suspend, make improvements to, or discontinue aspects of the services.
3.2 For Apps with PRO subscription the apps can offer an automatically renewable subscription (“PRO”) for a period of time. A subscription enables you to access and use the fill scope of the services for the subscription period. Payment will be charged to your iTunes account upon confirmation of purchase. It is your responsibility to turn-off your subscription at least 24-hours before the end of the current period if you do not want to renew the subscription.
4. About your device and third parties
4.1 It’s your responsibility to keep your phone and access to the app secure. We, therefore, recommend that you do not jailbreak or root your phone/tablet, which is the process of removing software restrictions and limitations imposed by the official operating system of your device. It could make your phone vulnerable to malware/viruses/malicious programs, compromise your phone’s security features and it could mean that the app won’t work properly or at all.
4.2 You should be aware that there are certain things that the developer will not take responsibility for. Certain functions of the app will require the app to have an active internet connection. The connection can be Wi-Fi, or provided by your mobile network provider, but the developer cannot take responsibility for the app not working at full functionality if you don’t have access to Wi-Fi, and you don’t have any of your data allowance left.
4.3 If you’re using the app outside of an area with Wi-Fi, you should remember that your terms of the agreement with your mobile network provider will still apply. As a result, you may be charged by your mobile provider for the cost of data for the duration of the connection while accessing the app, or other third party charges. In using the app, you’re accepting responsibility for any such charges, including roaming data charges if you use the app outside of your home territory (i.e. region or country) without turning off data roaming. If you are not the bill payer for the device on which you’re using the app, please be aware that we assume that you have received permission from the bill payer for using the app.
4.4 Along the same lines, the developer cannot always take responsibility for the way you use the app. i.e. You need to make sure that your device stays charged – if it runs out of battery and you can’t turn it on to avail the Service, the developer cannot accept responsibility.
4.5 With respect to the developer’s responsibility for your use of the app, when you’re using the app, it’s important to bear in mind that although we endeavor to ensure that it is updated and correct at all times, we do rely on third parties to provide information to us so that we can make it available to you. The developer accepts no liability for any loss, direct or indirect, you experience as a result of relying wholly on this functionality of the app.
4.6 At some point, we may wish to update the app. The app is currently available on iOS – the requirements for system (and for any additional systems we decide to extend the availability of the app to) may change, and you’ll need to download the updates if you want to keep using the app. The developer does not promise that it will always update the app so that it is relevant to you and/or works with the iOS version that you have installed on your device. However, you promise to always accept updates to the application when offered to you, We may also wish to stop providing the app, and may terminate use of it at any time without giving notice of termination to you. Unless we tell you otherwise, upon any termination, (a) the rights and licenses granted to you in these terms will end; (b) you must stop using the app, and (if needed) delete it from your device. The developer it is not also responsible if any of the services result in malfunction after any update even though he will do his best to solve any bug you report as soon as possible.
5. Changes to this Terms and Conditions
5.1 The developer may update our Terms and Conditions from time to time. Thus, you are advised to review this page periodically for any changes. I will notify you of any changes by posting the new Terms and Conditions on this page. These changes are effective immediately after they are posted on this page.
6. Contact
If you have any questions or suggestions about my Terms and Conditions, do not hesitate to contact us.
The use of VisionC has been cited by the following researchers:
- Fernández J, Rodríguez-Vallejo M, Rocha-de-Lossada C, Hueso E, Piñero D. Toric Intraocular Lens Calculation Considering Anterior Surgically Induced Astigmatism and Posterior Corneal Astigmatism. Curr Eye Res. 2022 Jan;47(1):25-31.
- Nováček LV, Němcová M, Sičová K, Tyx K, Rozsíval P, Němčanský J, Studený P. Simultaneous Presbyopia and Astigmatism Correction with a Novel Trifocal Toric Intraocular Lens-A One-Year Follow-Up. J Clin Med. 2022 Jul 19;11(14):4194.
- Fernández J, Rodríguez-Vallejo M, Martínez J, Burguera N, Piñero DP. Pupil dependence assessment with multifocal intraocular lenses through visual acuity and contrast sensitivity defocus curves. Eur J Ophthalmol. 2021 Nov;31(6):2989-2996.
- Fernández J, Rodríguez-Vallejo M, Martínez J, Burguera N, Piñero DP. Agreement between subjective and predicted high and low contrast visual acuities with a double-pass system. Graefes Arch Clin Exp Ophthalmol. 2021 Jun;259(6):1651-1657.
- Fernández J, Rodríguez-Vallejo M, Martínez J, Burguera N, Piñero DP. Long-Term Efficacy, Visual Performance and Patient Reported Outcomes with a Trifocal Intraocular Lens: A Six-Year Follow-up. J Clin Med. 2021 May 7;10(9):2009.